The sample is the group of people whom researchers actually examine and the population is the group of people whom the survey is about (Dörnyei & Ushioda, 2011, pp. 70-1). Dörnyei & Ushioda (p. 71) suggest that a good sample is very simlar to the target population in its most important general characteristics (e.g., age, gender, socioeconomic status, etc.) (Creswell, 2012, p. 141). Therefore, sampling procedures are designed to ensure this representativeness (Dörnyei & Ushioda, 2011, p. 71; Bordens & Abbott, 2014, p. 276).
In that regard, the represented population in this study consisted of 157 TESOL undergraduate students from which approximately 250 students at the university, from first year to the fourth year, 2016/2017. A purposive sampling technique was employed to collect data from four classes – one each from year one, two, three and four. In the quantitative part, the data obtained from the questionnaire is categorical data (ordinal) which its alpha level (p) is .05 and the value for selected alpha is .025 in each tail is 1.96.
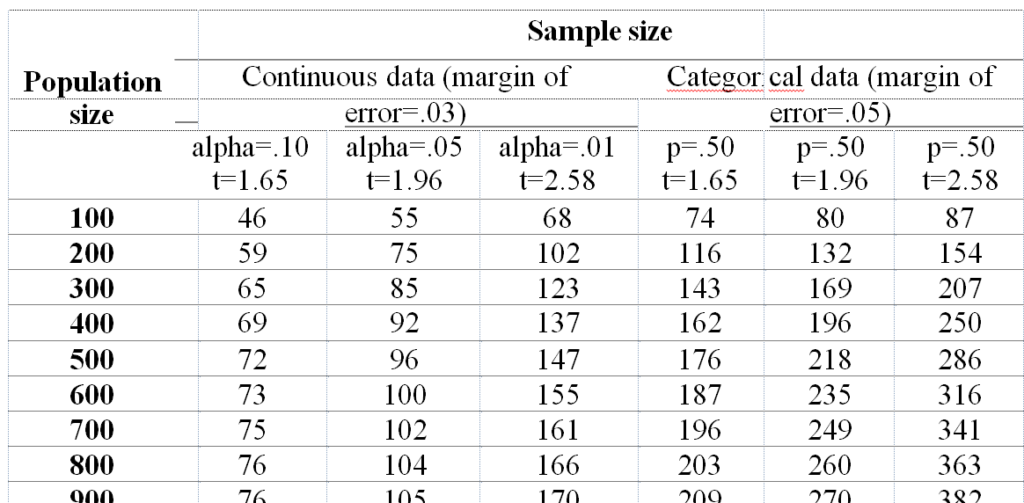
Table for Determining Minimum Returned Sample Size for a Given Population Size for Continuous and Categorical Data (Bartlett, Kotrlik and Higgins, 2001).
| Population | Sample size Continuous data (margin of Categorical data (margin of | |||||
| size | error=.03) | error=.05) | ||||
| alpha=.10 t=1.65 | alpha=.05 t=1.96 | alpha=.01 t=2.58 | p=.50 t=1.65 | p=.50 t=1.96 | p=.50 t=2.58 | |
| 100 | 46 | 55 | 68 | 74 | 80 | 87 |
| 200 | 59 | 75 | 102 | 116 | 132 | 154 |
| 300 | 65 | 85 | 123 | 143 | 169 | 207 |
| 400 | 69 | 92 | 137 | 162 | 196 | 250 |
| 500 | 72 | 96 | 147 | 176 | 218 | 286 |
| 600 | 73 | 100 | 155 | 187 | 235 | 316 |
| 700 | 75 | 102 | 161 | 196 | 249 | 341 |
| 800 | 76 | 104 | 166 | 203 | 260 | 363 |
| 900 | 76 | 105 | 170 | 209 | 270 | 382 |
| 1000 | 77 | 106 | 173 | 213 | 278 | 399 |
| 1,500 | 79 | 110 | 183 | 230 | 306 | 461 |
| 2,000 | 83 | 112 | 189 | 239 | 323 | 499 |
| 4,000 | 83 | 119 | 198 | 254 | 351 | 570 |
| 6,000 | 83 | 119 | 209 | 259 | 362 | 598 |
| 8,000 | 83 | 119 | 209 | 262 | 367 | 613 |
| 10,000 | 83 | 119 | 209 | 264 | 370 | 623 |
Therefore, the sample of this study is (132 + 169)/2 = 151.
On the other hand, only 8 students are chosen for the interview. There are 3 female students and 5 male students selected by the university administrator based on the academic achievement – one from the top and one from the lowest based on the school records. Therefore, there are 8 students from four classes were interviewed. First of all, the student who scored at the top in year 1 is female whose age is 19 year olds while the lowest one is male and he is 25 year olds. Both male students from year 2 whose ages are 21 (the top) and 24 (the lowest). Then the student who scored at the top in year 3 is again female whose age is 22 year olds while the lowest one is male and he is 23 year olds. Finally, the male student who scored at the top in year 4 whose age is 24 years old while the lowest one is female and she is 20 year olds. Therefore, there are 8 students from each class for the sample of qualitative design.


